|
Before the millennium (2000) we were hamstrung in understanding the immediate effect of promotional activity. It's well known News and TV content can drive a viral interest in something online. By the time regular web stats were available we'd lost around 24 hours of valuable time. In one of those eureka moments it became obvious there was a substantial server overhead with traditional stats, that's why back then they were processed off peak, typically early hours of next day. The simple solution we came up with those 25+ years ago was to shift the processing onto the viewers computer, feeding the data to javascript to process the data locally. The graphs below are examples of many reflecting our measuring of small town local events attendance growth following promotion. 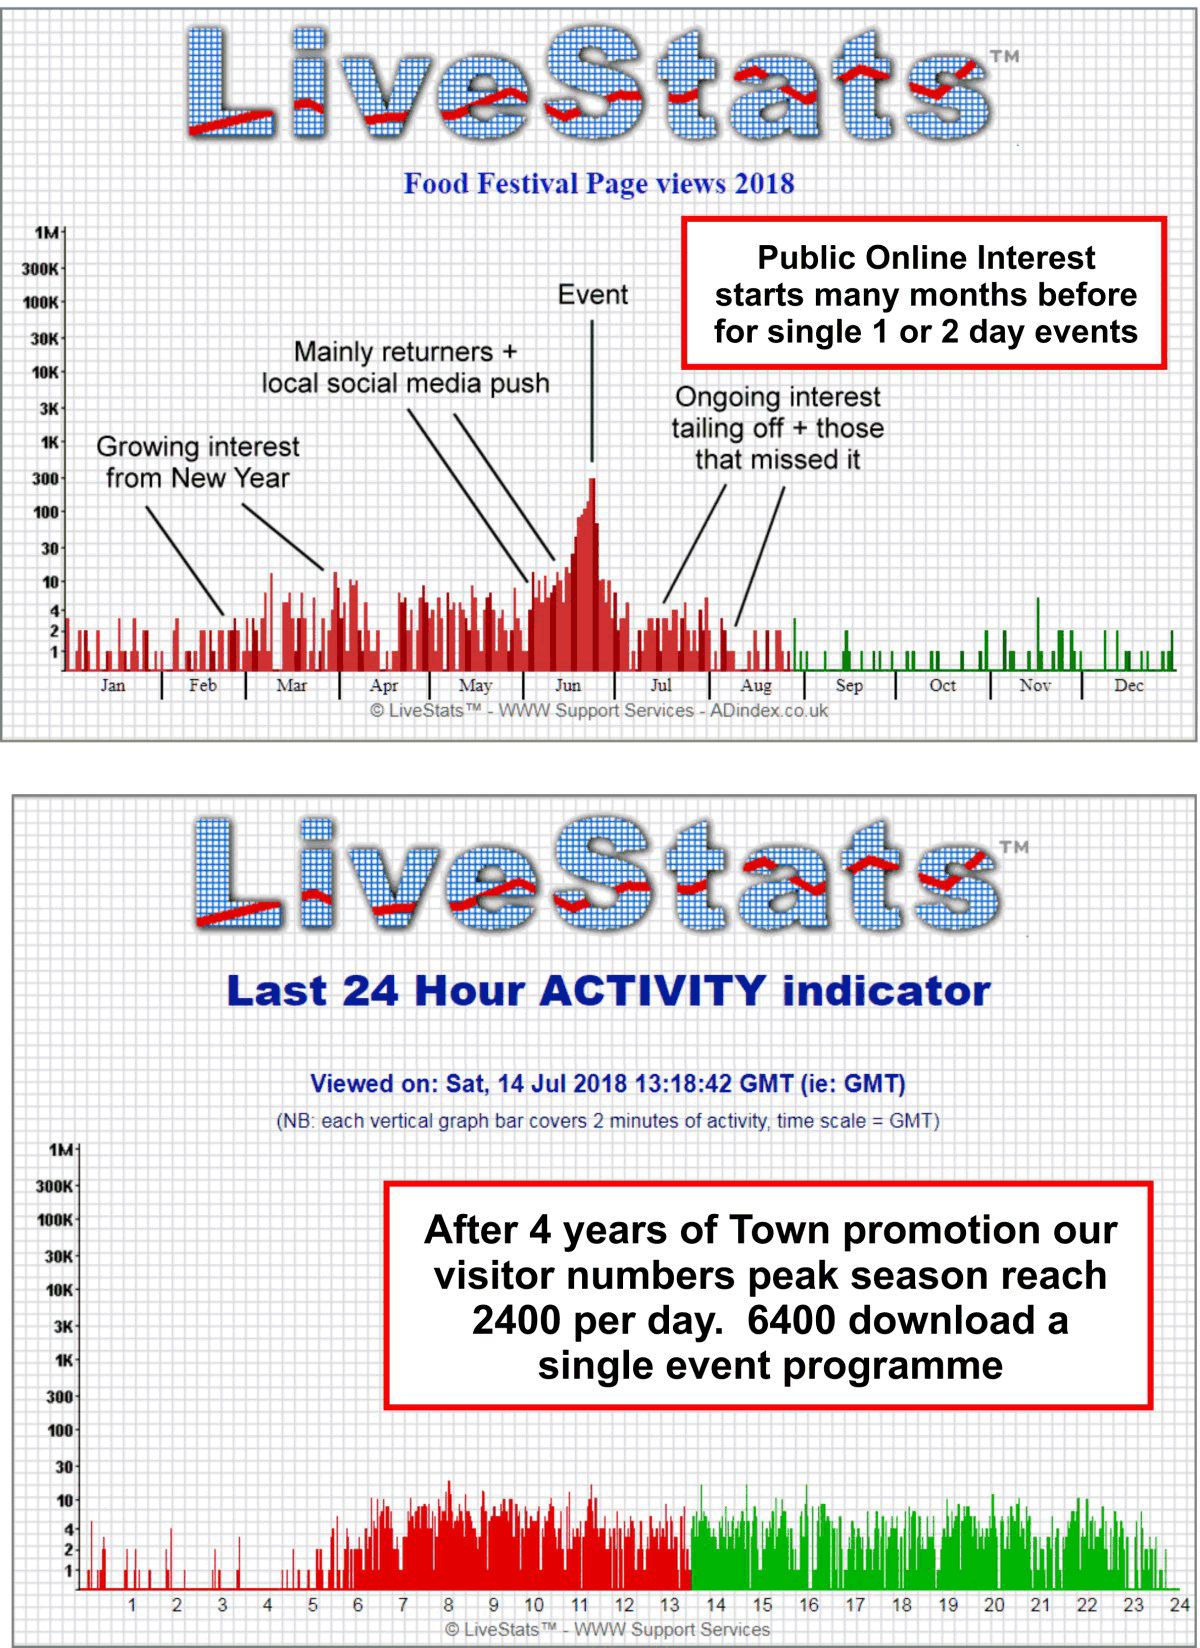 There was a minimal server overhead to simply increment a single number each time a view was triggered.
The remote viewer could simply call up the data and process it almost instantly to view. So LiveStats(tm) was born.
There was a minimal server overhead to simply increment a single number each time a view was triggered.
The remote viewer could simply call up the data and process it almost instantly to view. So LiveStats(tm) was born.
In the simple version most users wanted a bar on the graph for each day that could be seen to rise through the day, sometimes quickly. More importantly users later recognised our provision of the year display provided post marketing and media intelligence at a glance, no need to waste much time preparing figures, that work was already done effectively in real time. We're re-introducing LiveStats to assist those who want a quick and simple detailed performance measure over time. EnchantFilm.uk Created with RI (real intelligence) © designed, hosted & managed by Enchant Film tm Ltd |